 Heather Kopetskie, MS, is a Senior Biostatistician at Rho. She has over 10 years of experience in statistical planning, analysis, and reporting for Phase 1, 2 and 3 clinical trials and observational studies. Her research experience includes over 8 years focusing on solid organ and cell transplantation through work on the Immune Tolerance Network (ITN) and Clinical Trials in Organ Transplantation (CTOT) project. In addition, Heather serves as Rho’s biostatistics operational service leader, an internal expert sharing biostatistical industry trends, best practices, processes and training.
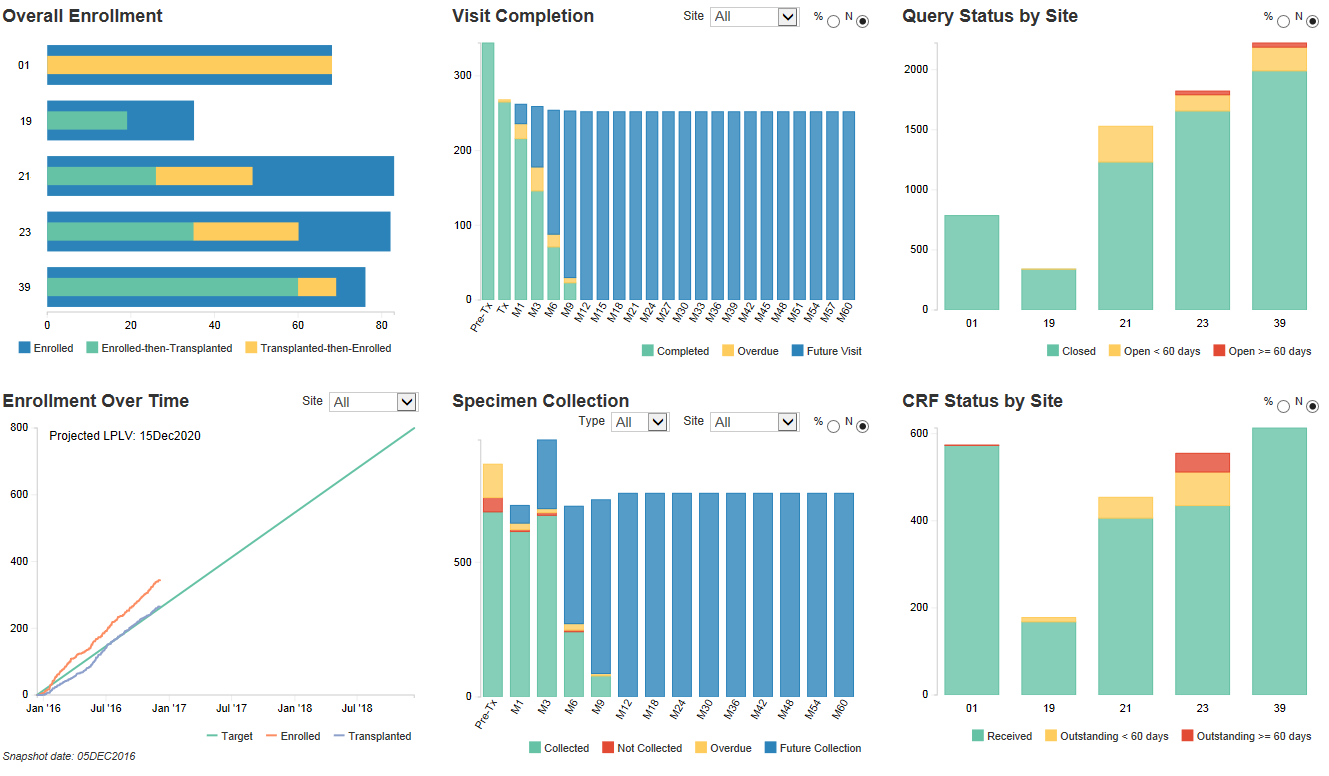
It’s important to track enrollment of a trial over time to make sure accrual goals are met but knowing the enrollment number alone isn’t sufficient to know how a study is progressing. Viewing enrollment visually can provide a quick overview of how enrollment is progressing in the trial as a whole but also how specific sites are performing, whether enrollment goals will be met, and key information about the enrollment population. Below are some graphics that have been valuable for us to keep track of site performance.
Most trials start with a rolling site activation as many factors impact when a site may be activated. Along with this each site may have a different target enrollment for a trial. The below Enrollment Over Time graph takes into account when sites are activated and their target randomization rate to show target rates over time to meet accrual goals along with actual enrollment rates. In addition to overall study status, the graph can be subset to review a particular sites status. In the Overall Enrollment bar graph, a quick overview of how many subjects have been screened, enrolled, and randomized at each site along with the target accrual are shown to quickly see which sites are performing and which sites need additional follow-up.

In some studies, it’s important to track sub-groups of enrollment. This can be done by including sub-bars that show what percent of subjects are in each group.
Dropout is a concern in many trials when the sample size guidelines project what is expected and how certain dropout rates will affect the power of the primary analysis. This graph lets us keep track of how we are doing with staying within the pre-specified dropout rates to ensure we aren’t loosing too much power to evaluate the primary endpoint.
![]()
Tracking enrollment overall and by site can help the study team manage the study and focus their efforts on sites that are lagging behind. Close monitoring of study dropouts is valuable so additional retention strategies can be put in place if needed before the number of dropouts has a detrimental effect on the power of a trial.