Blog Post
Introducing the Adverse Events Explorer
March 17, 2015
In the conduct of clinical trials, few tasks are as important as monitoring and reporting adverse events (AEs). The standard method of reporting AEs is to compile detailed listings of every adverse event reported in a study. Medical monitors and regulatory bodies are then tasked with reviewing these listings to monitor patient safety and search for complications and side effects associated with an investigational product.
For studies with large participant enrollment, severe diseases, complex treatments, or long treatment timelines, thousands of AEs may be reported, leading to scores of pages of listings. While comprehensive reporting is necessary, the current approach of creating page after page of listings is inefficient. Worse, this reporting approach creates a risk that that clinically-relevant safety signals will be obscured by the sheer volume of events reported.
Members of Rho’s Center for Applied Data Visualization (ADV) recognized an opportunity to improve upon this paradigm by creating an interactive web-based Adverse Event Explorer, which gives study monitors a more intuitive and powerful way to query AE data in real time.
The AE Explorer contains all of the information available in standard listings, but our tool adds simple graphics to aid with data comprehension and applies web-based interactivity to give users the ability to search their data in real-time.
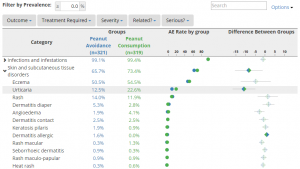
The default view of the Explorer is a single-screen display of AEs grouped by System Organ Class. Beside each row, a dot plot portrays the adverse event incidence for each treatment groups, which gives users a simple graphical comparison for their data. An additional graphic can be displayed to indicate the size of the difference between groups and whether the difference is statistically significant. Since humans more readily process graphics than abstract characters like numbers and letters, the graph helps bring the “story” of the data to life.
These graphics provide an intuitive visual component to the traditional AE report, but the real strength of the AE Explorer is in the interactive features that let users query the data in real time.
At a single click, the System Organ Class rows can be expanded to show the nested Preferred Terms underneath − each row with it’s own data and dot plot. Users can hover their cursor over the graphic elements to show additional detail about the data points. For any given AE, users can drill down to see a participant-level summary of the underlying data.
Events can be filtered by prevalence so that only AEs above a particular threshold (e.g., 5%) are displayed. Fully-customizable filters can also be created to allow users to filter their data at a click. For instance, users can filter by severity to drop out mild and moderate adverse events to focus only on events classified as severe or life-threatening. A search bar also lets users instantly search the listings for terms of interest (e.g., “headache”).
End users consistently report positive experiences when using the Explorer, noting that the tool saves time and gives them improved understanding of the data. We anticipate that the clinical trials industry will increasingly incorporate these types of powerful analytic tools into routine clinical trial management and reporting. In fact, a study-specific instance of our AE Explorer was recently used to report AE data for an article published in the New England Journal of Medicine.
Our AE Explorer improves the reporting and monitoring of AEs by applying data visualizations and contemporary web browsing practices to the traditional process. You can learn more about the AE Explorer and try it out for yourself on Rho’s public graphics-sharing website: graphics.rhoworld.com.